POSITIONAL FOOTPRINTING WEB SERVER
This section illustrates how to submit sequences to positional footprinting analysis on PEAKS server by using
a Saccharomyces cerevisiae gene promoters dataset.
In this example we will submit a dataset of 86 Saccharomyces cerevisiae yeast promoters of genes involved in amino acid metabolism according to the
second level of MIPS (Mewes et al., 2002) categories. Sequences span from -500 to +100 with respect to the
transcription start site (TSS) and were obtained from GenBank (Benson et al., 2005).
We will look for regions where fungal transcription factor binding sites significantly cluster and are thus are more
likely to be functional.
To scan for motifs we will use 54 fungal transcription factor matrices from TRANSFAC v.7 and a window size of 61 nucleotides.
1. Download the AA metabolism dataset to your computer: Sc. AA metabolism dataset
2. Open a new browser window with a PEAKS submission form: Submit an example dataset
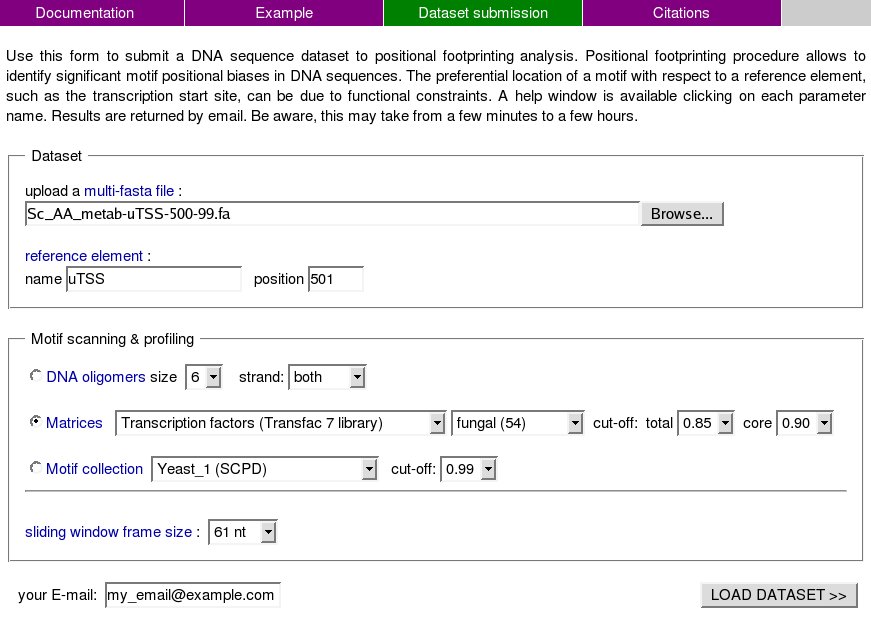
3. Selection of analysis parameters. Copy the parameters in the form below to your submision newly opened window and provide your email. When finished click on the "LOAD DATASET" button.

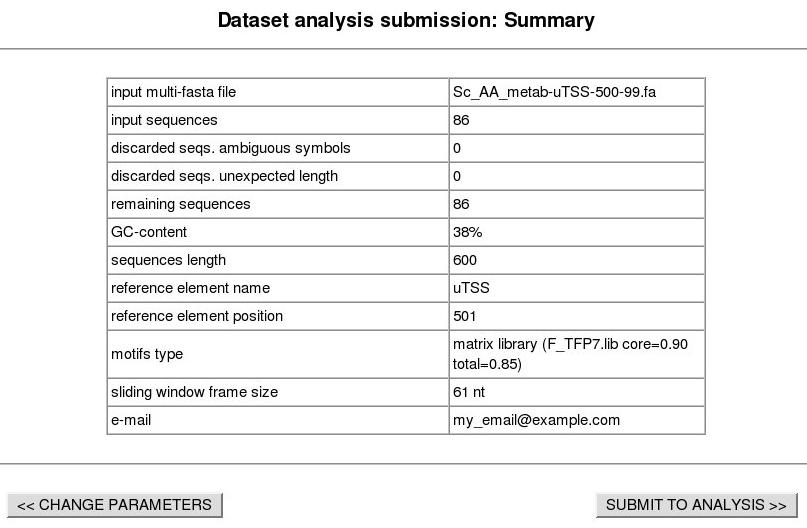
4. Dataset submission confirmation form. You should obtain a page like the one below. Click "SUBMIT TO ANALISYS" on your browser window.

The analysis has now been submitted.
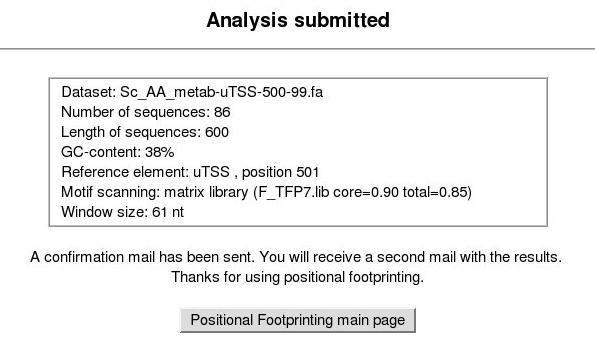
5. Analysis submission confirmation page. Next you should obtain a window like the one below.

Your job is running on the server. You should receive the results by email.
6. Results page. You can browse positional footprinting results at AA metabolism PEAKS results.
Two kind of figures provide information on significant motifs:
1) Significant motifs and ranges. The width of the ovals indicates approximate region boundaries and their height is the relative motif signal (RMS), defined as the number of sequences that contain the motif at the position with the maximum score divided by the number of sequences at the selected p-value cut-off. The table shows details on the number of sequences and position with the maximum score (max. peak), and the significant regions (ranges).
2) Motif profiles. The X-axis represents the sequence positions and the Y-axis the number of sequences with a match to the motif. The green line represents the p-value cut-off. Below the motif names are the position of max. peak, its associated score, and a link to a list of genes containing significant motifs.
In this case, at p-value < 1e-3 three different motifs are detected: TBP (matrix F$TBP_Q6), LEU3 (matrix F$LEU3_B) and GCN4 (matrix F$GCN4_01). The last two are known transcriptional regulators of amino acid metabolism , while the TATA binding protein (TBP) is part of the RNA polymerase initiation complex. LEU3 is the most upstream motif, while GCN4 is between LEU3 and the TATA box.
1. Download the AA metabolism dataset to your computer: Sc. AA metabolism dataset
2. Open a new browser window with a PEAKS submission form: Submit an example dataset
3. Selection of analysis parameters. Copy the parameters in the form below to your submision newly opened window and provide your email. When finished click on the "LOAD DATASET" button.

4. Dataset submission confirmation form. You should obtain a page like the one below. Click "SUBMIT TO ANALISYS" on your browser window.

The analysis has now been submitted.
5. Analysis submission confirmation page. Next you should obtain a window like the one below.

Your job is running on the server. You should receive the results by email.
6. Results page. You can browse positional footprinting results at AA metabolism PEAKS results.
Two kind of figures provide information on significant motifs:
1) Significant motifs and ranges. The width of the ovals indicates approximate region boundaries and their height is the relative motif signal (RMS), defined as the number of sequences that contain the motif at the position with the maximum score divided by the number of sequences at the selected p-value cut-off. The table shows details on the number of sequences and position with the maximum score (max. peak), and the significant regions (ranges).
2) Motif profiles. The X-axis represents the sequence positions and the Y-axis the number of sequences with a match to the motif. The green line represents the p-value cut-off. Below the motif names are the position of max. peak, its associated score, and a link to a list of genes containing significant motifs.
In this case, at p-value < 1e-3 three different motifs are detected: TBP (matrix F$TBP_Q6), LEU3 (matrix F$LEU3_B) and GCN4 (matrix F$GCN4_01). The last two are known transcriptional regulators of amino acid metabolism , while the TATA binding protein (TBP) is part of the RNA polymerase initiation complex. LEU3 is the most upstream motif, while GCN4 is between LEU3 and the TATA box.