
POSITIONAL FOOTPRINTING WEB SERVER
Overview
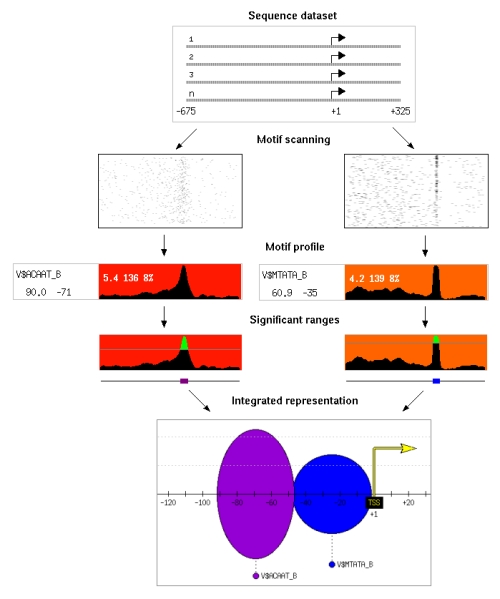
Sequence dataset
Motif scanning
Motif profile and positional footprinting score
Significant ranges
Integrated representation
The positional footprinting approach, implemented in PEAKS, detects motifs that show a significant clustering at a particular distance from a reference element. For example the analysis of a
subset of human promoters may reveal a high frequency peak of the TATA motif at around position -35 with respect to the transcription start site. Such motif positional biases are likely to respond to functional
constraints.
We use multiple sequences containing a reference element. The first step of the algorithm is motif scanning, where we run predictions of all putative motifs in the sequences, using transcription factor binding site matrices or oligomers. We use sliding windows to extract the motif frequency along each sequence and build motif profiles. We assign a signal to noise score to each position and estimate its p-value using random datasets. We then extract the significant positions where the motif is located. Finally, we build a promoter representation that contains all significant motifs and positional ranges in the sequence dataset.
In the diagram on the left one can see the results obtained for CAAT and TATA boxes in a sequence dataset comprising 1772 human promoters from the Eukaryotic Promoter Database (EPD).
The dataset is a group of DNA sequences that contains a functional reference element in fasta format (for a definition of this format see the help window in the submission form). The
sequences are uploaded from the user's computer.
All sequences must have the same length. Sequence length is obtained from the
first valid sequence encountered. If sequences of different length are subsequentely encountered they are discarded.
The reference element, for example the transcription start site (TSS), must be in the same position in each sequence (position 1000 in the example figure).
We identify motif matches in the sequences using motif libraries.
Available motif libraries are: (a) compilations of TFBS position-specific weight matrices (PSWMs), (b) all
possible DNA words of a given length or (c) pre-built consensus motif collections. PSWM libraries are from TRANSFAC (Matys et al., 2003), JASPAR (Sandelin
et al., 2004) and PROMO (Messeguer et al., 2002). Motif matches to PSWMs are defined using a matrix similarity cut-off, as described previously (Quandt et al., 1995).
Exact motif matches to DNA words of size 3 to 6 nucleotides can be used to discover novel putative motifs.
For each motif we run a sliding window along the sequences and count the number of sequences that contain at least one occurrence of the DNA motif within that window, assigning this number to the window central
nucleotide. The numbers obtained at each position along the sequence define the motif profile. Each position has an associated positional footprinting score (Spf), which measures the relative over-representation of the motif at
that particular position (see below for a mathematical description). The position with the maximum score is defined as the maximum peak.
This is an example of a motif profile corresponding to the NF-Y motif (JASPAR
PSWM library) in a sequence dataset comprising 1772 human promoters from the Eukaryotic Promoter Database
(EPD). The X-axis represents the sequence positions and the Y-axis the number of sequences with a match to the motif. The reference element is marked with a blue vertical line. Background color runs from pale yellow
at score 0 to pure red at scores equal or greater than 100. In the Figure, the Spf at the maximum peak, situated at position -72 with respect to the TSS, is 78.277. 344/1772 (19%) sequences show a motif match at this
position. There are 2552 total motif matches in the sequences.

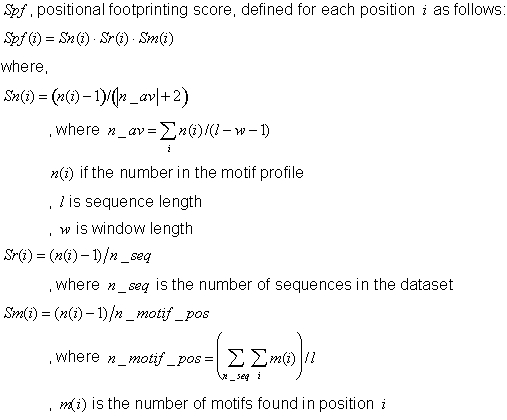
Positional footprinting score mathematical description
The positional footprinting score (Spf) results from the product of three different ratios:
Sn: It measures the level of the signal at a specific position with respect to the average signalalong the sequence.
Sr: It penalizes signals present in only a very small percentage of sequences, by dividing the signal at the specific location ratio by the number of sequences used.
Sm: It is the signal divided by the total number of motif predictions, which is useful to penalize matrices that are very noisy and occur at a very high frequency, probably due to low specificity of the matrix.
To assess the significance of the motif positional biases, we use 1000 different synthetic sequence datasets. By default they are generated according to an order 1 Markov model, in which the parameters are
estimated from the sequences and using a pseudocount of 1/q, where q is the number of entries in the probability distribution. In each
simulation we keep the score at the maximum peak. The scores from random simulations are distributed according to an extreme value distribution. We use this property to estimate the p-value that corresponds to a given score using linear interpolation.
The significant regions where motifs cluster under a given p-value cut-off (significant scores), and the specific motifs, are then retrieved. The p-value refers to each separate motif. Selection of a lower
p-value cut-off as the number of tested motif increases is recommended.
In the example on the rigth (NF-Y motif) the green line represents the p-value=1e-20 cut-off. Therefore, the area above the green line is the region significant at p-value < 1e-20, spanning from -106 to -46 with respect to the TSS.
In the example on the rigth (NF-Y motif) the green line represents the p-value=1e-20 cut-off. Therefore, the area above the green line is the region significant at p-value < 1e-20, spanning from -106 to -46 with respect to the TSS.
All significant motif regions are represented together in a single image. Each significant motif is represented as an oval, where the width is the significant
range/s, and the height is the relative motif signal (RMS). The RMS is defined as the maximum number of sequences that contain the
motif in the region over the number of sequences that contain the motif at the p-value cut-off level.
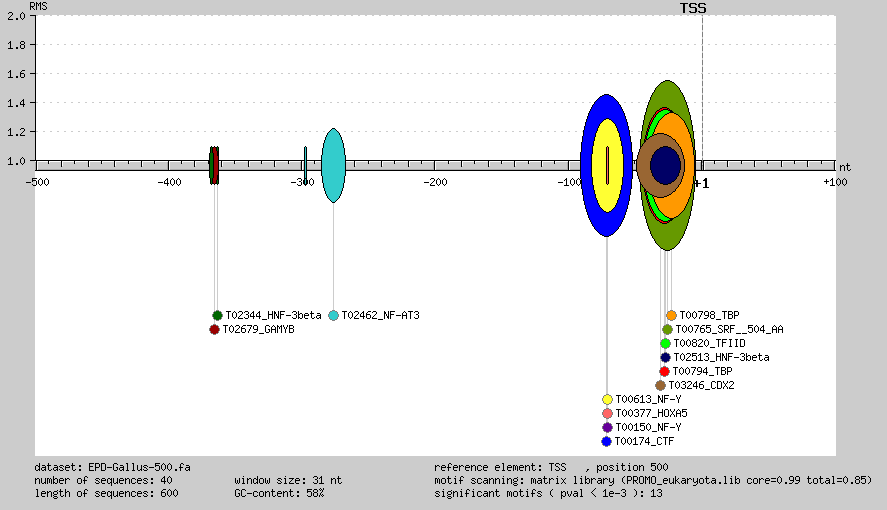
This integrated representation correspond to significant motifs (p-val<1e-3) ranges detected in a dataset
of 40 Gallus gene promoters, from EPD, using PROMO eukaryotic matrices.